Tuesday, May 24, 2011

LVH/ repolarization defects vs STEMI


One of the most confusing ST-elevation mimics is the “strain pattern” (or repolarization abnormality) occasionally found with left ventricular hypertrophy.
This is important because left ventricular hypertrophy is one of the most common causes of ST segment elevation in chest pain patients.
Many 12 lead ECG classes teach to recognize the voltage criteria for LVH (or at least one of the voltage criteria) but I don’t think most 12 lead ECG classes do an adequate job explaining exactly what a “strain pattern” looks like.
As a result, once the student identifies the voltage criteria for LVH, the interpretation stops. Similarly, once the student identifies the presence of “wide” QRS complexes, the interpretation often stops.
It’s as if we’re teaching students that it’s impossible to identify STEMI in the presence of baseline abnormalities.
It’s more difficult, but it’s certainly not impossible. The whole point is to know what a “normal” abnormality looks like. This is not an oxymoron! It’s the key to advanced 12 lead ECG interpretation.
In many cases, an ECG can meet the voltage criteria for LVH but show only minimal distortion of the ST segments and T waves. In other cases, the ECG will show the characteristic ST segment depression and T wave inversion in the lateral leads, but not the exaggerated ST segment elevation and T wave prominence in the right precordial leads.
Let’s look at some examples. Let us assume that we are dealing with a patient complaining of chest discomfort.
ECG courtesy of Dr. Jonas de Jong and ECGpedia.org


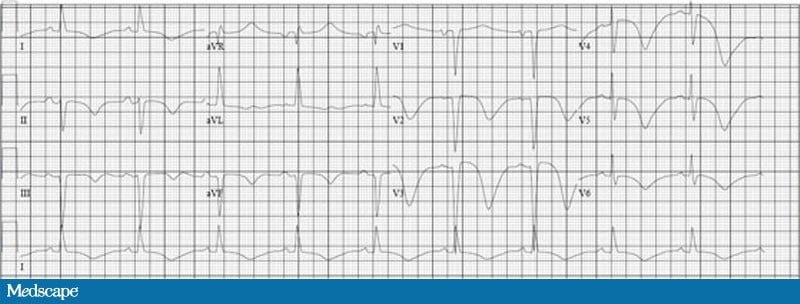
This is exactly the kind of ECG that gives  a lot of trouble. It demonstrates a strain pattern (or repolarization abnormality) with left ventricular hypertrophy. The good news is that it’s a very typical looking strain pattern!
Since this 12 lead ECG is not in the standard U.S. format, I used “cut” and “paste” to structure it into a pattern more typical of prehospital 12 lead ECGs in the U.S.

In the first place, you will notice that the rhythm is sinus at about 75 beats per minute (using the large block method).
The frontal plane axis is probably around 30 degrees (40 degrees if you correct by 10 degrees due to the fact that lead III is slightly positive). This is important because a common misconception is that left axis deviation will be present with left ventricular hypertrophy. By no means is this always the case!
The QRS width is less than 120 ms, so we know that we’re not dealing with a bundle branch block.
What about the ST segment elevation and huge T waves in the right precordial leads! Surely this patient is experiencing acute anterior STEMI!
Negative, ghostrider! (For my international friends, this is a reference to the movie Top Gun).
Let’s look at the relationship between the QRS complex and the T waves in this ECG. The general pattern is one of discordance. In other words, When the QRS complex is positive (especially in the lateral leads I, aVL, V5 and V6) the T wave is negative. This is sometimes referred to as a widened QRS/T angle.
In addition, the ST segments are downwardly concave and the T waves are asymmetrical.
These are the cardinal findings with strain patterns (or repolarization abnormalities) secondary to left ventricular hypertrophy.
This ECG also shows ST segment elevation in the right precordial leads (V1, V2 and V3). You will note that the ST segments are upwardly concave and the severity of the ST segment elevation and T wave height is proportional to the depth of the S wave.
This is extremely important! With left ventricular hypertrophy, the deeper the QRS complex, the higher the ST segment and more pronounced the T wave abnormality.
This is also true of the ST segment depression and T wave inversion typically found in the lateral leads. The higher the R wave, the deeper the ST segment depression and more pronounced the inverted T wave.
Consider the following graphics to illustrate the point.
The most pronounced ST/T wave abnormality is found in lead V2. It’s difficult to tell because the QRS complexes run into one another, but the S wave is extremely deep in lead V2, possibly as deep as 35 mm (blue arrows). With LVH, you should expect the lead with the deepest S wave to show the most ST segment elevation and/or T wave height!
The red curve shows the upward concavity of the ST segment, which is another common finding with LVH. I have seen upwardly convex ST segments with LVH, but it’s rare, and it always makes me suspicious of acute anterior STEMI!
I’ve outlined the shape of the T wave with orange lines. You can see that the T waves are asymmetrical, another finding consistent with a “strain pattern” or depolarization abnormality with LVH.
In the left precordial leads, the most most pronounced ST/T wave abnormality is found in lead V5. Again, it’s difficult to discern because the QRS complexes run into one another (as they often do with LVH) but the height of the R wave may be as high as 30 or even 40 mm (blue arrows).
The red curve shows the downwardly concave ST segment depression (exactly opposite the right precordial leads).
I have outlined the T wave inversion with orange lines to show the asymmetry. Again, a common finding with “strain patterns” or depolarization abnormalities with LVH.


Example #1.


This is an atypical “strain pattern” with many typical features.
I suspect the possibility that leads V1 and V2 might have been accidentally transposed but that doesn’t really matter. For the purposes of STEMI recognition, the typical features outweigh the atypical features.
In the first place, you should immediately notice the “widened QRS-T angle” that is the hallmark of a secondary repolarization abnormality. You will notice the same finding for LBBB and paced rhythm!
Importantly, the degree of the secondary ST-T abnormality is, generally speaking (there are some caveats), proportional to the size (or amplitude) of the QRS complex in the opposite direction!
If you take nothing else away from this post, please learn this “trick”.

Herein lies a problem with prehospital 12-lead ECGs!
With left ventricular hypertrophy (LVH) the QRS complexes are often “cut off” at the top or bottom or they run together with other QRS complexes which can create the illusion that the QRS complexes are smaller, so you have to train your eye!
Take a look at this ECG and find the most severe ST-T wave abnormality.
That’s easy! Lead I clearly shows the most pronounced ST-T wave abnormality. The ST-segment is depressed, downwardly concave, and shows a deep inverted T-wave.
Does the amplitude of the R-wave in the opposite direction explain it? No way! It’s even smaller than the QRS complex in lead II, and the ST-T wave abnormality in lead II isn’t nearly as severe!
What is the second-worse ST-T wave abnormality? Lead V3! Does the depth of the S-wave in the opposite direction explain it? Not really.
But wait! Are we certain we’re getting an accurate “read” on the amplitude of the R-wave in lead I and the depth of the S-wave in lead V3?
I’m not so sure!


I suspect the possibility that the computer is “cropping” the QRS complexes to fit them on the ECG paper. See the little horizontal line that marks the “top” and “bottom” of these QRS complexes?
I’ve seen it many times before!
So ask yourself this question:
Generally speaking, does there seem to be a relationship between the QRS-complex and the degree of ST-elevation or depression in the opposite direction?
If the answer is “Yes!” then don’t call the STEMI Alert. Instead, perform serial ECGs and look for changing ST-segments and T-waves! ST-segments and T-waves shouldn’t “evolve” or change over time if it’s a simple secondary ST-T wave abnormality!
Example #2


ST segment morphology

check out this post... on ST segment morphology
http://ems12lead.com/2009/06/04/st-segment-morphology/


Because acute myocardial infarction (STEMI) is not the most common cause of ST segment elevation in chest pain patients, we need to consider other factors like reciprocal changes to shore up the diagnosis.
It’s also a good idea to be well versed in the typical appearance of the STE-mimics (paced rhythms, left ventricular hypertrophy, benign early depolarization, pericarditis, left ventricular hypertrophy, hyperkalemia, and so on).
Another factor that can assist you is an analysis of the morphology of the ST segment.
The normal ST segment should not be flat. It should have an upward concavity sometimes referred to as a “take-off”.
When an ST segment loses its concavity and becomes straight or upwardly convex, it can indicate acute myocardial infarction.
Consider this image from WJ Brady, SA Syverud, C Beagle et al. Electrocardiographic ST-segment Elevation: The Diagnosis of Acute Myocardial Infarction by Morphologic Analysis of the ST Segment Acad Emerg Med 2001; 8(10):961-967

You can draw an imaginary line between the J point and the apex of the T wave. If the ST segment is below that line, then it’s upwardly concave. If it’s even with or above that line, then it’s “non-concave” (straight or upwardly convex) which is suspicious for acute myocardial infarction.
(Note: As I learned on Facebook on 12/22/2010 this phenomenon was described in Pardee HEB. An electrocardiographic sign of coronary artery obstruction. Arch Intern Med 1920; 26: 244– 257 and referred to as “coving” of the ST-segment.)
If it helps you to remember, an upwardly concave ST segment makes a “smiley face” (good) and an upwardly convex ST segment makes a “frowny face” (bad).

Does that mean that acute myocardial infarction always presents with non-concave ST segments when ST segment elevation is present?
Not at all! This finding is not particularly sensitive. It is, however, fairly specific. When non-concave ST segments are present, it’s another piece of the puzzle.
The STE-mimics almost always present with upwardly concave ST segments and an absence of reciprocal changes.
*** NOTE: Dr. Smith from Dr. Smith’s ECG Blog disputes this claim and has shown me a couple of cases of left ventricular hypertrophy with upwardly convex ST-segments in the right precordial leads that were not experiencing STEMI. ***
You might have noticed that I used the phrase “upwardly concave” as opposed to simply “concave”.
That’s because “concave” is “convex” depending on your perspective. That’s why I always mention the direction of the concavity or convexity.
Sometimes this can get confusing! Consider this image from the AHA’s new STEMI book.

The caption says “concave down” even though it’s referring to an ST segment that is upwardly concave. This may have been a typo, but I think it’s always helpful to use standardized definitions/language when it comes to medicine (or incident command)!
Regardless, if you look at this image from the STEMI book, the second window shows ST segments with a loss of upward concavity (ST segment straightening) and hyperacute T waves.
After PCI, you can see the development of Q waves and terminal T wave inversion (which usually indicates a STEMI that’s been around for a while).
It’s tough when a chest pain patient presents with an ECG with ST segments like we see in the third window. It’s often difficult to determine the age of an ECG abnormality like that.

Axis determination

This one is a really good video for axis determination....very simple and to the point...Thanks Christopher..:)

Axis determination

http://www.youtube.com/watch?feature=player_embedded&v=kOdk20FgcC0


so now its soo easy to tell the axis by just looking at Lead 1, aVf and lead 2.....:)

Adding few other facts....
aVr : always negative...
Pwave in Lead 1 is always positive...
if not then lead placement is wrong for sure....

Saturday, May 14, 2011

Chronic Bronchitis


Chronic bronchitis recurs and becomes long-term (chronic), especially in people who smoke. A cough that produces too much sputum and is present most days during a 3-month period for at least 2 years in a row suggests chronic bronchitis. Chronic bronchitis is a form of chronic obstructive pulmonary disease (COPD).


Chronic bronchitis is treated symptomatically. Inflammation and edema of the respiratory epithelium may be reduced with inhaled corticosteroids. Wheezing and shortness of breath can be treated by reducing bronchospasm (reversible narrowing of smaller bronchi due to constriction of the smooth muscle) with bronchodilators such as inhaled β-Adrenergic agonists (e.g.,salbutamol) and inhaled anticholinergics (e.g., ipratropium bromide). Hypoxemia, too little oxygen in the blood, can be treated with supplemental oxygen. However, oxygen supplementation can result in decreased respiratory drive, leading to increased blood levels of carbon dioxide and subsequent respiratory acidosis.
The most effective method of preventing chronic bronchitis and other forms of COPD is to avoid smoking cigarettes and other forms of tobacco.

Acute Bronchitis

Acute bronchitis develops suddenly. It generally lasts less than 2 to 3 weeks. Most healthy people who develop bronchitis get better without any complications.


Acute Exacerbations of Chronic Bronchitis (AECB) are frequently due to non-infective causes along with viral ones. 50% of patients are colonised with Haemophilus influenzae,Streptococcus pneumoniae or Moraxella catarrhalis. Antibiotics have only been shown to be effective if all three of the following symptoms are present:- increased dyspnoea, increased sputum volume and purulence. In these cases 500 mg of Amoxycillin orally, every 8 hours for 5 days or 100 mg doxycycline orally for 5 days should be used.


Treatment for acute bronchitis is primarily symptomatic. Non-steroidal anti-inflammatory drugs (NSAIDs) may be used to treat fever and sore throat. Decongestants can be useful in patients with nasal congestion, and expectorants may be used to loosen mucus and increase expulsion of sputum. Cough suppressants may be used if the cough interferes with sleep or is bothersome, although coughing may be useful in expelling sputum from the airways. Even with no treatment, most cases of acute bronchitis resolve quickly.


Only about 5–10% of bronchitis cases are caused by a bacterial infection. Most cases of bronchitis are caused by a viral infection and are "self-limiting" and resolve themselves in a few weeks.  As most cases of acute bronchitis are caused by viruses, antibiotics should not be used, since they are effective only against bacteria. Using antibiotics in patients without bacterial infections promotes the development of antibiotic-resistant bacteria, which may lead to greater morbidity and mortality. Antibiotics should be prescribed only if examination ofgram-stained sputum shows large numbers of bacteria present.

Pneumonia treatment

In the UK empiric treatment is usually with amoxicillinerythromycin, or azithromycin for community-acquired pneumonia. In North America, where the "atypical" forms of community-acquired pneumonia are becoming more common, macrolides (such as azithromycin), and doxycycline have displaced amoxicillin as first-line outpatient treatment for community-acquired pneumonia. The use of fluoroquinolones in uncomplicated cases is discouraged due to concerns of side effects and resistance.The duration of treatment has traditionally been seven to ten days, but there is increasing evidence that short courses (three to five days) are equivalent. Antibiotics recommended for hospital-acquired pneumonia include third- and fourth-generation cephalosporinscarbapenemsfluoroquinolonesaminoglycosides, and vancomycin. These antibiotics are often given intravenously and may be used in combination.


Generic NameBrand Name
amoxicillinAmoxil, Dispermox
azithromycinZithromax
clarithromycinBiaxin, Biaxin XL
doxycyclineDoryx, Monodox, Vibramycin
erythromycinEryc, EryPed, Ery-Tab
trimethoprim and sulfamethoxazole combinationBactrim, Septra, Sulfatrim

Cerebrovascular induced repolarization defects inECG

Recently I came across this interesting case where patient had Hemorrhagic stroke and also had repolarization defects -- QT prolongation, T wave inversion..---in her ECG....Quite interesting huh!!!


so here is the case ( from Medscape):


An 81-year-old woman presents to the emergency department (ED) with an altered mental status. The patient was in her usual state of health until she vomited several times earlier today. Her family attributed the vomiting to discontinuation of her metoclopramide therapy, which she was taking for diabetic gastroparesis. The medication was stopped because the patient's family was concerned that this medication was aggravating her facial dyskinesia. As the day progressed, the patient was noted to have difficulty communicating; she could neither understand commands nor verbalize simple phrases. In addition, she was noted to be unable to move her left upper extremity. The patient lives alone. She has no documented history of trauma but does have a history of repeated falls. She has a medical history of end-stage renal disease requiring hemodialysis, insulin-dependent diabetes mellitus, hypertension, and coronary artery disease that is poorly defined. Her medications include aspirin, insulin, sevelamer hydrochloride, simvastatin, labetalol, and enalapril.
On physical examination, the patient appears ill, with a temperature of 98.4°F (36.9°C), a blood pressure of 180/89 mm Hg, a heart rate of 72 bpm, and a respiratory rate of 14 breaths/min. Her oxygen saturation is 96% while breathing room air. The findings of the pulmonary, cardiac, and abdominal examinations are within normal limits. The neurologic examination, however, reveals a patient that is aphasic and has left hemiparesis. Her finger-stick blood glucose level is 112 mg/dL (6.2 mmol/L).
An electrocardiogram (ECG) is ordered:

The patient's ECG demonstrated a sinus rhythm at a rate of 60 bpm, with a markedly prolonged QT interval of 680 msec (normal range for females, <470 msec) and deep, symmetric T-wave inversions most pronounced in the anterior precordial leads (V2-V6). Because of the patient's altered mental status and focal neurologic findings, a noncontrast computed tomography (CT) scan of the head was obtained, which demonstrated bilateral, frontal subdural hemorrhages

The patient in this case was admitted to the intensive care unit for cardiac monitoring, serial neurologic examinations, and further testing. An MRI of the brain confirmed a right-sided acute ischemic stroke, but the presence of the small subdural hemorrhages (likely the result of the patient's recurrent falls) prevented the use of antiplatelet therapy in this patient. The ECG changes normalized within 2 days and the cardiac enzymes remained within normal limits. An echocardiogram was performed on hospital day 2 which demonstrated moderate diastolic dysfunction, with no focal wall motion abnormalities. A repeat CT scan of the head on hospital day 4 showed no progression of the small subdural hemorrhages. The patient's neurologic exam did not change from her initial presentation and she was discharged to a skilled nursing facility on hospital day 5.
The pathogenesis of ECG changes and cardiac arrhythmia in the setting of a CNS event involves alterations in the complex neural-cardiac pathways that are responsible for normal autonomic control of cardiac function. In the setting of acute stroke, autonomic tone is dysregulated by a predominant adrenergic surge of catecholamines (such as norepinephrine). In particular, involvement of the insular cortex by the CNS event is commonly associated with a surge in norepinephrine, and it is associated with an increased rate of arrhythmias and death. 
Adrenergic overstimulation may lead to ventricular systolic dysfunction and wall motion abnormalities, with or without serum biochemical markers of myocardial necrosis. The classic description of adrenergically mediated cardiac dysfunction is termed "takotsubo cardiomyopathy"; it presents with apical wall motion abnormalities in the setting of severe emotional stress.
 A recent report described a presentation of takotsubo-like apical ballooning in association with ischemic-like ECG changes and elevated serum cardiac biomarkers in the setting of acute subarachnoid hemorrhage.

Despite marked cardiac wall motion abnormalities during the acute presentation, a repeat echocardiogram 1 week after the event showed complete resolution of the cardiac regional wall motion abnormalities. The presence of regional wall motion abnormalities during acute stroke is a well-described entity. Kono et al performed coronary angiography in 12 patients with acute stroke symptoms and the presence of ischemic ECG changes and regional wall motion abnormalities. Despite the presence of focal wall motion abnormalities, none of these patients demonstrated significant coronary artery stenosis or evidence of coronary vasospasm. On follow-up echocardiographic examination, the regional wall motion abnormalities in these patients had resolved.

Treatments aimed at limiting adrenergic stimulation to the heart (beta-adrenergic receptor antagonists) can be given if the patient manifests evidence of cardiac dysfunction or injury. In cases of severe systolic dysfunction, supportive measures such as loop diuretics, supplemental oxygen, and/or endotracheal intubation may be necessary. While no randomized data support their use in stroke-mediated cardiac dysfunction, angiotensin-converting enzyme inhibitors (ACEI) and statin therapy are also reasonable options.[